
I recently attended a private Google Ads Sales Representative (ASR) event in Uzbekistan organised by Coob Ads Uzbekistan. Here are several interesting insights about the local Google Ads market 👇
The figures below restate data presented at the event reported in October 2026. The original post did not include a public report or sampling methodology, so use them as a historical reference rather than an independent assessment of the entire market.
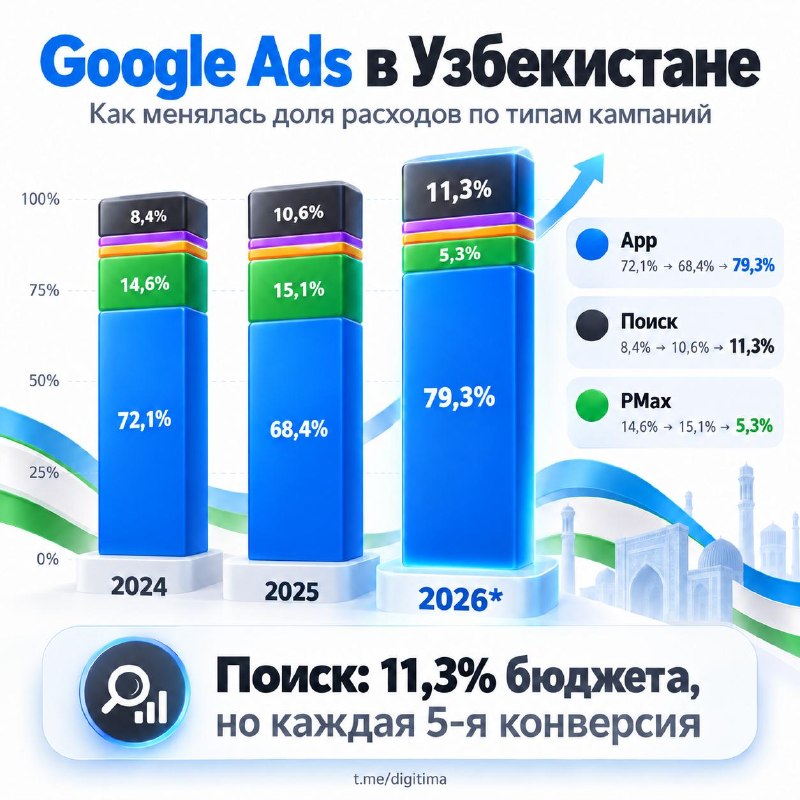
📊 How advertising budgets are distributed by campaign type
In 2026, App campaigns account for the largest share of advertiser spend at 79.3%. Their share has increased by 7.2 percentage points in two years, making mobile apps the main driver of Google Ads investment. 📱
The role of other campaign types is changing:
🔍 Search is growing, from 8.4% in 2024 to 11.3% in 2026. Its budget share remains relatively small, but Search delivers every fifth network conversion.
📉 After growing in 2025, PMax fell from 15.1% to 5.3% — the most significant decline among the main campaign types.
🛒 Shopping is gradually growing to 1.5%.
The shares of Display, Demand Gen, video and smart campaigns remain small and are generally declining or almost unchanged.
💡 The central conclusion is that Uzbekistan’s Google Ads market is increasingly concentrated around App campaigns. Search, however, remains one of the most valuable conversion tools despite its 11.3% budget share.
What these share changes mean
Budget share describes market structure, but it does not prove that a campaign type will be effective for a particular business. The dominance of App campaigns may reflect the composition of the largest advertisers, while Search growth may demonstrate the value of existing demand at a smaller scale.
Use this data to form hypotheses, then test available demand forecasts, conversion cost and customer quality in your own category. When comparing years, ensure that the methodology is consistent and account for the incomplete 2026 reporting period.